
After making a new 2022 low on October 12th, the S&P500 advanced 13.5% to December 1st, then rolled over to decline 6.2% for the month of December. There were only eight days where the market moved higher, but those up days were generally smaller than the 14 down days. The largest declines occurred upon the Fed’s December 14th policy meeting and the three days following. So much for a Santa Rally.
S&P equal weight (RSP) and value (RPV) declined 5%, the NASDAQ declined 9%, and the bond index (AGG) shed 1.3%.
For the year:
- The S&P 500 declined 18.5%
- RSP/S&P 500 equal weight declined 13%
- AGG/Bond index declined 14.5%
- The NASDAQ declined 33%
- RPV/S&P 500 Pure Value was down 3%
The tried-and-true 60/40 portfolio (Vanguard balanced 60% S&P 500/40% AGG) declined 19%. 20+ year U.S. treasuries lost 31%. The only sector in the green was energy.
This was the first year in decades where bonds did not provide the cushion that they traditionally provide, as the correlation between stocks and bonds was historically high.
2022 Backdrop
2022 was a challenging year, to say the least. Broad stock indexes incurred their largest losses since 2008 during the great financial crisis. Bonds have not seen losses this size for at least 35 years! The macroeconomic headwinds of high inflation, the speed and aggressiveness of Fed rate hikes, the conflict in Ukraine, and imbalances resulting from the global shutdown from the pandemic created an environment where, in hindsight, many of the excesses arising from the pandemic induced recession were unwound.
Volatility was high throughout the year. For 65% of the trading days, the NASDAQ saw moves up or down more than 1%, the highest level since 2000-2002.
As the infographic immediately below shows, there were six significant drawdowns, ranging from -6% to -16%.
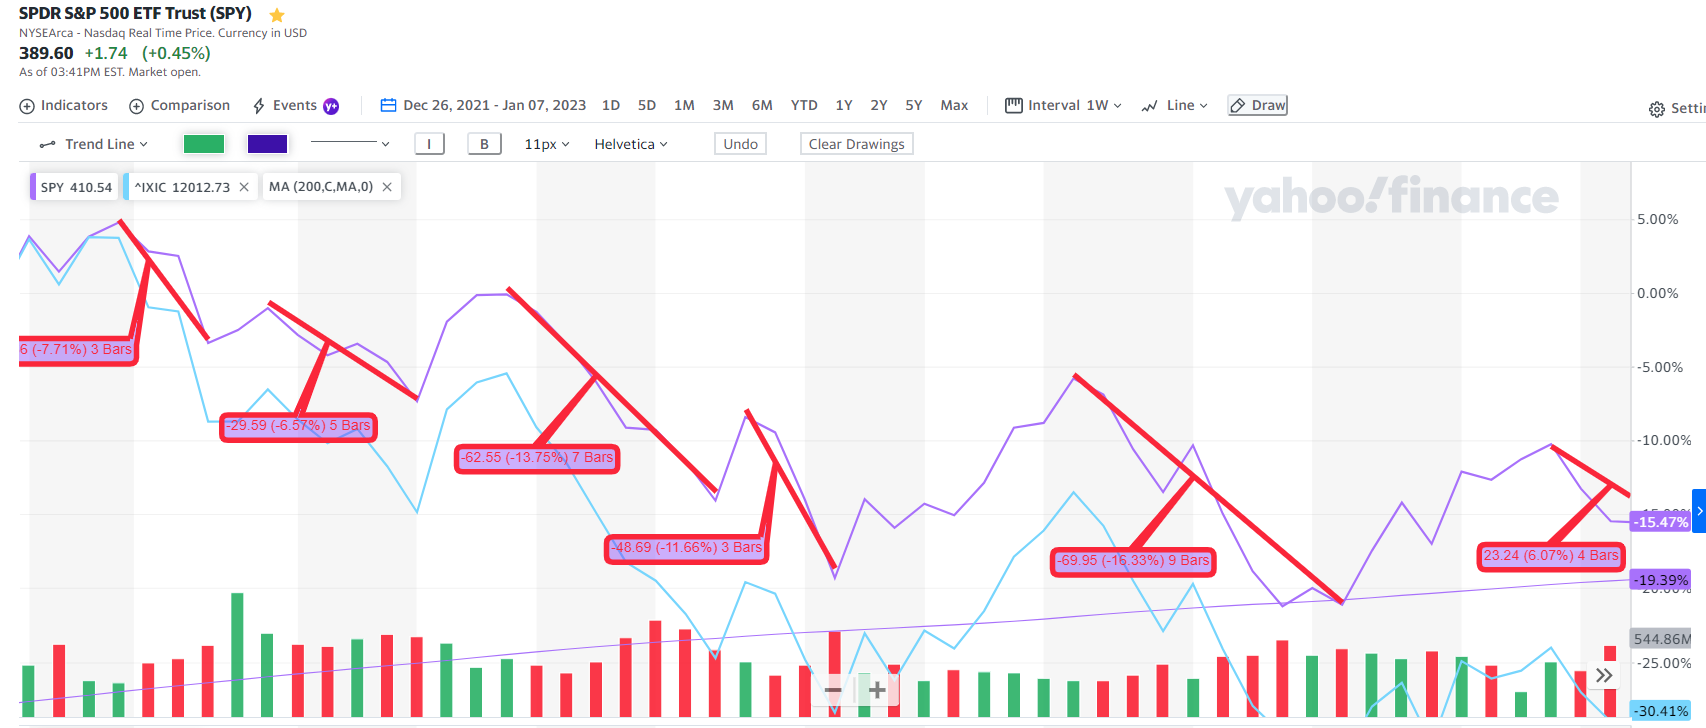
____________________________________________________________________________________________________________________________________
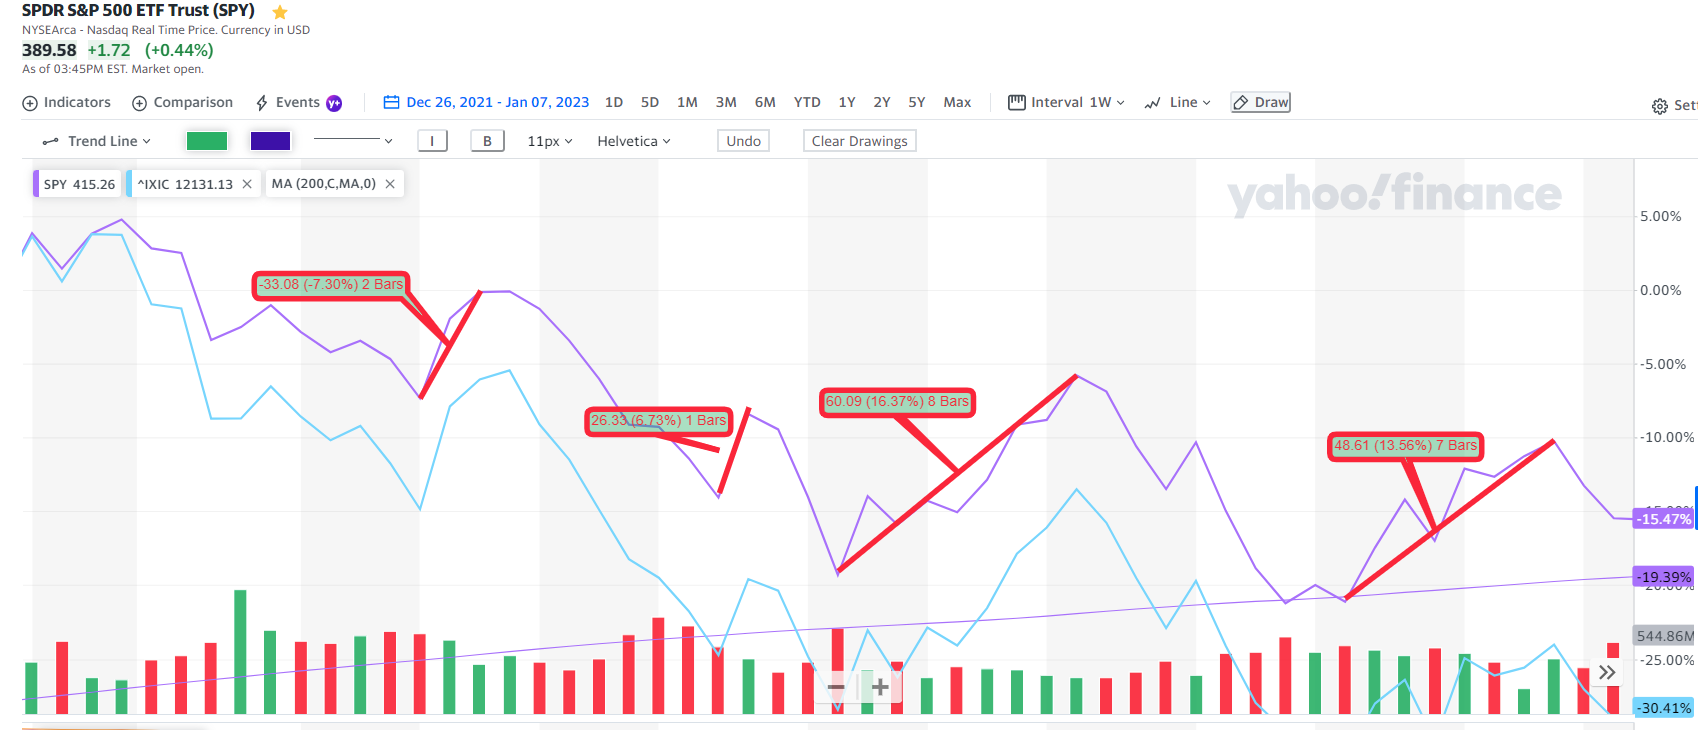
There were four countertrends, or “bear market” rallies, ranging from +6% to + 16%, as indicated in the infographic below:
These sharp declines and advances make trend following difficult, particularly when compressed over such short periods of time. On two occasions (the June swoon and again in December), we ended up on the wrong side of the trade, having reduced risk at the June low and adding risk at the December peak. However, we were ahead of the curve during the August decline, having reduced risk earlier during the steepest sell-off of the year. Our new daily model evaluation should help moving forward.
One cannot just look at returns without also looking at the amount of risk taken. Our process assisted in our managing your portfolios with less risk than had we done nothing throughout the year.
Evaluating our TWG Moderate 75/25 portfolio (vs. its benchmark) reveals the following risk statistics:
Standard deviation (measure of volatility): 13.26 vs 18.08
Beta (measure of risk): .53 vs .77
Max drawdown: 19.41% vs 22.18%
A combination of allocating capital to areas of the market that declined less than the broad market, reducing exposure to risk assets throughout the year and avoiding long bond duration helped us take less risk than the broad market and our portfolio benchmarks.
——————————————
2022 In Review
At the beginning of the year, no one really knew whether inflation would be transitory or enduring. Many changes arose out of the pandemic that seems to have created a confluence of events that set the stage for the potential end of the bull market of the 2010’s. Human behavior, business activity and economic factors dramatically changed because of the pandemic:
High inflation. A decade of cheap money. Work from home. Quiet quitting. Unaffordable housing. Excessive risk taking and speculation. De-globalization. Dysfunctional politics. Supply/demand imbalances. Grain and food distribution disruptions. Decreased energy supply. Early retirement. Doing more with less. Prioritization of experiences vs material items. Rolling shutdowns in China.
All of these items (and more) set the stage for a shift in life as we knew it.
But then it became clear that prices for goods and services continued to increase, and the priority of the Federal Reserve, as well as central banks around the world, was to eradicate one of the most damaging economic forces — inflation.
Long duration assets got hit first. Those companies were yet to be profitable, as they were fairly new to the market, thus earnings were not expected until way into the future. Investors were no longer willing to own shares of companies that were not making money. The most speculative business models, many of which were considered disruptors during the pandemic, sold off in dramatic fashion. Peleton (down 70%), Zoom (down 65%), Teledoc (down 75%), Carvana (down 98%). These are just a few of the unprofitable companies that were the beneficiaries of the stay-at-home era, and when the world re-opened and investors realized that future earnings would need to be heavily discounted due to a higher interest rate environment, shareholders exited in droves.
Even the once high-flying (yet profitable) darlings that made up the popular investor acronym FAANG, were not immune to a higher rate environment. Meta (formerly Facebook) was down 65%, Netflix down 51%, Amazon was cut in half. Apple, the most valuable company in the U.S. declined 30%. Even companies that should have benefited from the world re-opening got hit hard – Caesers Entertainment, down 55%. Expedia down 51%, Carnival cruise down 60%. Simply put, when rates are higher, the current value of companies’ future earnings must be discounted more than when rates are zero. This discounting made high valuation companies that much more expensive overnight. Many of these companies had experienced demand pull forward during the pandemic. They expanded operations and hired more workers as their products or services were bought in a frenzy and became essential during the stay-at-home era. That, along with cheap money and excess speculation caused their stock prices to be bid faster than their earnings were growing, resulting in extreme levels of valuation. Many companies’ valuations became too high to support an era where money was no longer free and demand destruction was the objective of a Federal Reserve committed to bring down inflation.
For a while, it was thought possible that the excess savings accumulated from pandemic era stimulus checks (which, at the time, no one knew how long the world would be shut down or whether the risks of COVID could be abated) would buy consumers time to ride out this inflationary spike until prices moved meaningfully lower. Then it became clear that the labor force was too strong, and wage growth too powerful, to naturally ease the forces of inflation. Many early retirees simply decided not to return to the workforce. With an aging population, it was possible that the labor force would continue to decline. Fewer workers resulted in a demand for higher wages just to keep employees working. Higher wages enable consumers to continue to spend, which keeps demand elevated. Supply imbalances, while improving, are still not in harmony with demand. This all adds up to challenging a quick relief from the forces of inflation, thereby requiring the Fed to raise rates higher, and for longer than anyone would have imagined at the beginning of the year.
Throughout the year there were several periods where market participants believed the Fed would stop raising rates, and perhaps lower rates sooner than what the Fed was forecasting. This fed “pivot” became a reason to be optimistic and bid up the stock market again. These “relief rallies” proved to be short lived, and typically ended when Fed Chief Powell clearly stated that rates would stay higher for longer. Yet market participants often continued to disbelieve what the Fed was saying in no uncertain terms. “Don’t fight the Fed” should probably be honored, as the reality is likely to prove that the Fed, resolute in its mandate of price stability and full employment, will keep rates high until inflation moves meaningfully closer to its target of 2%. This is a challenging task given all the economic dynamics at play.
While it might be clear in hindsight that the market was ripe for a pullback given the macroeconomic backdrop, what is NEVER clear is when the market peaks and bottoms. Prudent investing requires a long-term view and trying to time the peaks and troughs of the market’s economic cycles is a fool’s errand. While we generally do not subscribe to a “buy and hold” philosophy, we do believe that having an objective process to manage risk under these conditions is paramount to achieving your long-term goals. As you are likely aware from viewing your account statements and from reading our monthly notes, we have, throughout the year, accumulated cash so as to not ride a declining market down to levels that would be detrimental and require significant forward gains to recover from of a decline of asset values. As the market ebbs and flows, increases, and decreases, so does your risk exposure and cash accumulation.
We are highly confident, that sometime in the not-so-distant future, inflation will come back down to earth, corporate America will be leaner, more efficient, continue to innovate, excess speculation will wane, and consumers will continue to spend on necessities and discretionary items, and a new cycle of economic expansion will emerge.
PUTTING DECLINES INTO PERSPECTIVE
One’s time horizon is one of the most important factors in determining an appropriate portfolio design, or how much risk one should be able to tolerate. We pride ourselves in taking the time to actively listen to you to understand the purpose behind the funds that you entrust us to prudently manage for your benefit. For those dollars that will be called upon in the near term, taking risk is not appropriate, and low risk, short duration asset classes can at least enable those assets to maintain their purchasing power.
For those dollars that will not be called upon until sometime farther out in the future, it matters less what the value is today and instead matters what its value will be at the time it is to be utilized. Achieving long-term goals often requires compounding growth of assets, over time, at the very least to maintain their purchasing power at some point in the future. If long term inflation averages 2% (as it did for most of the past 20 years), then growing your assets at 4% would improve your purchasing power over time, creating opportunities for your savings and investments to work for you and provide more for you and your loved ones than if you simply took no risk. If one is unwilling to take ANY risk (think cash in the coffee can), then the inherent risk of that strategy is your safe cash is losing value to the long-term effects of inflation. There must be a balance between the two, and that is one area that we help you determine within the confines of your comfort level and tolerance for price fluctuations.
For those in retirement that require regular monthly distributions it is important that there are lower risk assets that can be called upon when other risk assets are declining. We typically prefer to take “house money”, or gains from your portfolio to meet your monthly distributions. And during times when there may not be gains to take, to have a backup asset class that is not down, or down as much. The goal is to not be forced to sell assets at depressed levels to meet your cash needs, which would remove the opportunity for them to rebound. Throughout this year as our process reduced risk and accumulated cash, this cash was used to meet your distribution requirements. Our processes cash trigger assist in taking risk off the table before those risk assets have declined to levels that would be detrimental to recover from. This, in turn, enables us to meet your cash needs through a variety of market conditions and mitigates the long-term damage that would occur should we have no other choice but to sell something that is down 10/20/30%. Most of the cash raises throughout the year were affected when the position was down a modest amount, which this year happened to be risk assets (RPV) that declined LESS than bonds. Alternatives and non-correlated asset classes were also introduced this year for this very purpose.
PORTFOLIO ADJUSTMENTS
We want to note that our primary growth funds, QQQ and RPG, have not been a part of your portfolio since we evacuated QQQ on January 14th. We never re-entered the growth complex due to its significant declines and the impact from higher rates. QQQ ended the year down 33%, and you avoided about 28% of that decline due to our management. We maintained some degree of exposure to RSP equal weight, which was down 13% on the year vs an 18% decline on the market cap weighted S&P. The balance of your portfolio through the year was allocated to value funds – VTV, which declined 4.75% in 2022, and RPV which was down 3%. Where we were invested throughout the year was down significantly less than the broad market, and we never owned anything that was down more than the market. 2022 was a year to not take excessive risk, which we adhered to.
Given the thrust higher in November, our process recommended increasing exposure to equities during December. We increased exposure to RSP, S&P 500, and SPTM on December 1st, only to later eliminate our S&P 500 position on December 15, and slightly reduce exposure to RSP and SPTM on December 30th. We also significantly reduced our position in RPV on December 22nd and 28th, ending the year with a substantial cash position around 35%.
LOOKING AHEAD
Historically, markets rarely see two consecutive down years. 2000-2002 was an outlier, and we believe that there is a high probability of the stock market ending the year higher than where it started. However, there is still more work to be done on the inflation front, and the Fed will likely not stop raising rates until it is confirmed that inflation will stay back down to the 2-3% range. We hope that the Fed will stop raising rates around the 5-5.5% Fed funds rate level, some .75% higher than where it is now. The full effects of 2022’s rate increases have yet to fully make their way through the economy, and the Q4 earnings season will likely reflect a slowdown in demand and economic activity. But we should be closer to the end of the interest rate hike cycle than the beginning.
The market is forward looking, anticipating the state of the economy 6-9 months down the road. Earnings probably have to come down to below the historical market multiple of 16. Should earnings decline, then the stock prices should follow. Earnings continued to grow during 2022, albeit at a slower pace than years prior. Q4 should be the first quarter of meaningful earnings decline, which makes sense given the lagging effects of rate increases. 1Q earnings may show a continued decline, which will help position the economy for an eventual rebound – perhaps during the second half of the year or early 2024.
Over the past months a trend of declining inflation data has emerged, which is positive and indicates that the Fed’s intended impact is working. The Fed should eventually pause in raising rates, giving the economy some time to fully absorb and manage the stress that rapid rate increases have on economic activity. After a pause, and continued declines in inflation, we hope that earnings can trough, which would set the stage for an end to the bear market and period of economic contraction.
We are comfortable with the sizable cash position we have leading into the new year, which will limit the impact of any further declines in the stock market. We are closely monitoring the upcoming earnings season, which will be helpful to better understand the state of the economy and the effects of last year’s rate increases. Eventually, after rates stop going up and inflation continues to decline, there will be a re-acceleration in growth. This is simply a reconciliation of a decade of low interest rates that will take time to unwind and adjust to. Bear markets typically last around 15 months, and we’re getting close to that average duration.
Together, we will get thought this challenging market environment and will see a time when the economy is stronger and more stable than it was pre-COVID. The cyclicality of a global economy, through expansion and contraction, is not unusual, and periodic removal of excesses that build up during expansionary periods is a necessary component to sustained growth over time. Going back over 130 years, financial markets are positive some 70% of the time, and we don’t see this average deviating from history.
Until next month, we wish you well.